Paper presented at the American Society of Criminology
annual meeting, November 13-16, 2002, Chicago, Illinois.
The IIRP gratefully acknowledges the assistance of the juvenile probation departments of Northampton, Bucks, Montgomery, and Lehigh counties, Pennsylvania, for providing access to court data used in this analysis.
The Community Service Foundation (CSF) and Buxmont Academy operate six school/day treatment programs (abbreviated as “CSF Buxmont schools”) in southeastern Pennsylvania. They are non-secure community treatment settings for adjudicated delinquent and at-risk youth.[1] Additionally, CSF operates three auxiliary programs—the residential, intensive supervision, and home and community programs. The residential program provides group home services to a portion of students attending CSF Buxmont schools. The intensive supervision program provides additional support to youth released from drug treatment facilities. Finally, the home and community program provides a variety of support services for youth experiencing family, emotional, and drug and alcohol related crises. Some students attending CSF Buxmont schools participate in multiple programs simultaneously.
All of these programs utilize what is broadly termed “restorative practices.” Restorative practices provide both high levels of control and high levels of support to encourage appropriate behavior.[2] The philosophy underlying these practices holds that human beings are happier, more productive, and more likely to make positive changes in their behavior when those in positions of authority do things WITH them, rather than TO them or FOR them. This hypothesis maintains that the punitive and authoritarian TO mode and the permissive and paternalistic FOR mode are not as effective as the restorative, participatory, and engaging WITH mode.
CSF Buxmont has developed a culture in which “restorative” characterizes not only staff interaction with youth, but staff-to-staff and student-to-student relationships as well.[3] This researcher has coined the term “restorative milieu” because CSF Buxmont culture is comprised of many restorative techniques and processes and not just isolated restorative interventions.
Within this restorative milieu, youth are held accountable for their actions while being given the social and emotional support necessary to make changes. Restorative practices empower the young person and the group to develop their own behavioral standards and actively confront misbehavior. The young people act as a micro-community of support for each other, consciously building interdependency and a sense of responsibility to the community. This process is facilitated by CSF Buxmont staff.
CSF Buxmont schools have an excellent reputation for empowering youth to make positive changes. However, since their founding in 1977, they have never been formally evaluated. This analysis tests the effectiveness of restorative practices in encouraging positive changes among adjudicated delinquent and at-risk youth. However, correlation does not mean causation. To conclude that any observed changes in attitudes or behavior are the result of participation in CSF Buxmont’s restorative milieu, four conditions must be met:
1) The attitudes and behavior of youth must significantly improve.
2) These improvements must be positively related to the length of participation.
3) These improvements must remain after controlling for known risk factors, such as age, gender, race, and prior offending.
4) These improvements must remain after controlling for the effects, if any, between these risk factors and early program discharge (case selection bias).
METHODS
Subjects
This analysis presents the outcome experiences of the 919 youth discharged from CSF Buxmont schools between June 1, 1999 and August 30, 2001. The 334 youth discharged during the 1999-2000 school year and the 445 youth discharged during the 2000-2001 school year include all youth discharged during these school years. The 140 youth discharged during school year 1998-1999 include only those discharged during the final two weeks of that school year.
The total number of youth discharged from CSF Buxmont schools between the 1999-2000 school year and the 2000-2001 school year increased by 33% (from 334 to 445). Reflecting the expansion of CSF Buxmont programs generally, this increase in the number of discharges was greatest for school referrals, with a one year increase of 69% (from 104 to 176), compared to 18% among probation referred (from 192 to 226), and 13% for children and youth referrals (from 38 to 43).
Youth are referred to CSF Buxmont schools from three sources: juvenile probation (56% or 516), children and youth services (10% or 88), and individual school districts (34% or 315). Probation referrals are overrepresented among discharges prior to September 1999 (70%), and children and youth referrals are somewhat underrepresented (5%) during this time period.
Demographics. The demographic distribution of cases is presented in Table 1.
| Table 1 CSF Buxmont Schools Sample |
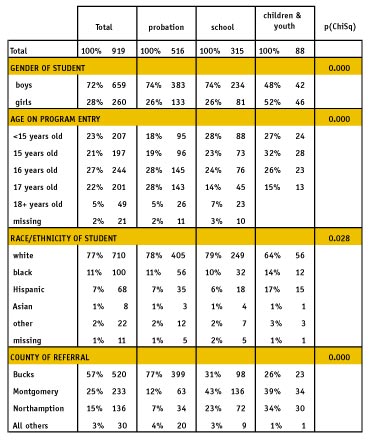 |
1) Gender
Overall, girls represented 28% (260) of all discharged youth, most of whom were referred by probation. A majority of children and youth referrals were girls (52%), compared to one-fourth of probation and school referrals (both 26%).
2) Age
Overall, 55% of youth were 16 years old or older upon entering CSF Buxmont schools. Probation referred youth were older than those referred by schools or children and youth. Most of probation referred youth (62%) were 16 years old or older when entering CSF Buxmont schools, compared to less than half of school and children and youth referrals (47% and 41% respectively). The average age on entry into CSF Buxmont schools was 15.8 years old for probation referred youth, 15.5 for school referred youth, and 15.3 for children and youth (F = 12.2; p < .001).
3) Race
Most youth referred to CSF Buxmont schools were white (77%), followed by black (11%) and Hispanic (7%). The race of youth differed significantly by referral source. The great majority of youth referred by probation and schools were white (78% and 79% respectfully), while a smaller majority of those referred by children and youth were white (64%). Hispanic youth totaled 17% of children and youth referrals, compared to 7% for probation and 6% for school referred youth. Black youth constituted 14% of those referred by children and youth, 11% of probation, and 10% of school referrals (ChiSq = 16.3, df = 6, p < .05).
4) County of referral
Youth are primarily referred by three counties: Bucks (57%), Montgomery (25%), and Northampton (15%). Three percent of referrals were from Lehigh, Monroe, and Chester counties (26, 3, and 1 referrals respectively). Most of those referred by probation were from Bucks (77%), with fewer from Montgomery (12%), and Northampton (7%). The largest percent of school referred youth were from Montgomery (43%), followed by Bucks (31%), and Northampton (23%). Among children and youth referrals, the largest percent were from Montgomery (39%) and Northampton (34%), with fewer from Bucks (26%).
Overall, race was unrelated to gender, with whites constituting 79% of boys and 75% of girls. Likewise, age was unrelated to gender, with the mean age upon entering CSF Buxmont schools being 15.7 years old for boys and 15.6 for girls. Hispanic youth were significantly younger (15.2), than were white youth (15.7), black youth (15.6), or Asian youth (15.5) (F = 2.69, df = 4, p < .05). Also, Hispanic youth tended to be younger with 62% under 16 at program entry, compared to 43% of whites, 48% of blacks, and 43% of others. Children and youth referrals tended to be younger, were twice as likely to be girls, and nearly three times more likely to be Hispanic than youth referred by probation or school. Because of the overrepresentation of Hispanic and younger youth referred by children and youth, this age by race relationship became insignificant once referral source was taken into account.
A higher proportion of youth from Northampton County were minorities (38%), than Montgomery (28%), or Bucks (13%). One-quarter of Northampton County referrals to CSF Buxmont schools were Hispanic, compared to 3% for Bucks County and 6% for Montgomery County. Compared to other counties, a higher proportion of youth referred from Bucks were white, from Northampton were Hispanic, and Montgomery were black.
Delinquency. Criminal history information was gathered during intake interviews on 666 youths, including 364 referred by probation, 228 by schools, and 74 by children and youth. Among these, all of the probation referrals, 39% of the school, and 32% of the children and youth referrals had been arrested prior to entering CSF Buxmont schools.
Among those arrested, drug or alcohol related offenses were the most common (29%), followed by assault-related offenses (26%), theft (22%), violations against the public order (12%), and other offenses (12%). Of those arrested for assault-related offenses, one-third involved aggravated assault or robbery (44 of 133). Less than 1% (5) were placed for a sexual offense.
Among those with previous arrests, probation referred youth were more likely to have committed drug and alcohol related offenses or theft related offenses (31% and 24%) than school (25% and 17%) or children and youth referred (13% and 19%). School referred youth with prior arrests were more likely to have committed an assault (32%) than probation (25%) or children and youth referrals (26%). Offense type did not differ between race or gender.
Arrest history distributed in much the same way as current offense in that probation referred youth had more serious criminal histories. Among those who had been arrested, 67% of probation, 46% of school, and 39% of those referred by children and youth had been arrested more than once. Among those with multiple arrests, the number of prior arrests did not differ between referral source, age on admission, gender, or race.
Among the youth with prior court adjudications, probation referred were more likely to have been first adjudicated before age 14 (25%) than school or children and youth referrals (both 12%). Age at first adjudication was unrelated to race or gender.
PROCEDURES
In April 1999, CSF Buxmont implemented the evaluation protocol of the Program Development and Evaluation System (ProDES), an outcome-based information system that tracks delinquents for the duration of his or her involvement with the juvenile justice system. This system was developed by Temple University’s Crime and Justice Research Center. Its primary focus is program development, providing a continuous flow of intermediate (changes during the program) and ultimate (recidivism and community adjustment) outcome information. This performance monitoring system was designed to track delinquent youth for Philadelphia Juvenile Court. Since 1993, ProDES has gathered data on more than 20,000 juvenile delinquents placed in more than 78 programs.[4]
ProDES collects information on each youth’s current offense, prior record, socio-demographic information, and family structure. Also, ProDES collects information through risk and needs assessments, and self-esteem and values assessments at three points: program entry, program discharge, and six months following discharge. This system’s scales have been empirically derived and have high reliability. Follow-up data is gathered by checking official court records, through the self report of juveniles and interviews with the juvenile’s caregivers. ProDES has demonstrated the utility of official records, parent reports, and self report data in monitoring program and system performance.
All new admissions were to be interviewed within one month and assessed not sooner than a week nor later than a month following admission. New admissions are students entering CSF Buxmont schools for the first time and students returning after an absence of three months or more (excluding summer break). Students admitted prior to April 1999 were treated as “grandfathers” and were not interviewed unless they were returning after an absence of three months or more. Students returning with less than three months of interruption (excluding summer break) are treated as a continuous stay with a period “out of program.”
Overall, matched intake-exit interviews were collected among half (49.8%) of the 919 discharged youth. Compliance with the protocols for the 665 youth admitted after August 1999 was 94% for assessments, 84% for intake interviews, and 80% for exit interviews. Eighty-eight percent of all intake interviews were conducted within the 30 day window.
Independent Variables
CSF Buxmont School/Day Treatment Exposure. Youths attend CSF Buxmont schools for differing lengths of time depending on a variety of factors. Most are returned to public school after a few months when their referral source and the CSF Buxmont staff deem that the youth’s behavior has sufficiently improved. Others are discharged when they turn 18, graduate, or complete their GED. Some youth are discharged for a variety of behavioral problems, most within a short period of time, but some after extensive participation.
The primary factor determining the length of exposure was discharge type. The two discharge types are defined as:
1) Normal Discharge—Youth successfully completes the program by returning to public school, graduating or receiving GED, or upon turning 18 years old.
2) Behavioral Discharge—Youth is discharged prior to completing program for failure to attend, running away, showing repeated noncompliance with program directives, violating conditions of their probation, or for an arrest resulting in a new placement.
Since the start of a new school year or semester presents minimally disruptive opportunities to return youth to public schools, many are discharged at these times. Because CSF Buxmont admits youth continuously over the course of the year, some near the end of the school semesters, length of stay for youth receiving normal discharges varies widely. Lastly, some youths attend CSF Buxmont schools for multiple school years, but most do not.
Overall, the mean length of exposure to CSF Buxmont schools was 104 school days (20.9 weeks), with a minimum of none (for 2 youths) and a maximum of 531 days (106 weeks). Half of all youth spent 87 days (17.4 weeks) or more. Among normal discharges, the average length of exposure was 118 school days (23.7 weeks), with half attending for 103 days (20.6 weeks) or longer. Among behavioral discharges, the average length of stay was 77.2 school days (15.4 weeks), with half being discharged within 58 school days (11.6 weeks). While probation referred youth were less likely to receive a behavioral discharge than those referred by schools or children and youth, the difference in length of exposure becomes insignificant, once type of discharge was taken into account. Among behavioral discharges, the length of program exposure did not significantly differ by the type of behavior problem.
Auxiliary Program Exposure. As stated above, CSF also operates a residential care program providing group home services, an intensive supervision program for youth returning to the community from residential drug rehabilitation programs, and a home and community program providing other various support services to youth in crisis. These programs operate as auxiliaries to CSF Buxmont schools.
Youth utilize various combinations of these programs as deemed necessary by their referral source, themselves, and CSF Buxmont staff. Youth referred by schools generally do not participate in these auxiliary programs. Some probation referred youth participate in a combination of all four programs.
Among the 88 children and youth referrals, 72% spent some time in residential care and the remainder did not participate in any auxiliary program. Among those that participated in residential care, the mean length of residential stay was 179 days, with half spending less than 166 days (min = 8, max = 546). The mean length of stay in residential care for those referred by children and youth was shorter for those receiving behavioral discharges (123 days) than it was for normal discharges (222 days) (F = 12.4, df = 1, p < .001).
Among the 516 youths referred by probation, 63% (325) participated in one or more auxiliary program. Among those that participated in only one of these programs, 11% (54) participated in residential care, 10% (52) in the home and community program, and 6% (29) in the intensive supervision program. Among those that participated in two or more auxiliary programs, 24% (124) participated in both residential care and intensive supervision, 4% (22) participated in residential care and home and community, and 3% (14) in both intensive supervision and home and community. Among probation referred youth, 6% (30) participated in all three auxiliary programs.
Among the 230 probation referred youth spending some time in residential care, the mean stay was 147 days with half spending less than 140 days (min = 2, max = 453). Among the 170 participating in the intensive supervision program, the mean length participation was 172 days with half spending less than 166 days (min = 1 max = 455). Among the 87 in the home and community program, the mean length of participation was 114 days with half participating less than 88 days (min = 3 max = 407). In any of these auxiliary programs, the length of participation for probation referred youth was not significantly different between normal and behavioral discharges.
Some of the probation referred youth participated in the intensive supervision program or home and community program prior to entering CSF Buxmont schools and some participated in one of these programs following discharge. Among the 516 probation referred youth, 5% (25) participated in intensive supervision prior to attending CSF Buxmont schools, and 26% (136) continued in the intensive supervision program after they were discharged. Also, 11% (54) participated in the home and community program prior to attending and 10% (53) participated in home and community following discharge from CSF Buxmont schools. The mean length of exposure to an auxiliary program prior to attendance was 47 days for intensive supervision (median = 8, min = 1, max = 252), and 69 days for home and community (median = 43, min = 1, max = 387). The mean length of participation in these programs following discharge is 71 days for intensive supervision (median = 62, min = 1, max = 214), and 75 days for the home and community program (median = 64, min = 8, max = 324).
There is an important caveat limiting the results presented in this report. Not all youth in CSF’s intensive supervision program or home and community program attended a CSF Buxmont school. Data was not collected for these youth. Since these youths may differ from those included in this study in a number of ways, the results of this evaluation can not be generalized to apply to these CSF auxiliary programs in their whole.
Complicating the analysis beyond the varying mixes of auxiliary program exposure, for youth attending a CSF Buxmont school, is that the length of this exposure is related to the length of attendance. This creates a high level of time-dependent multi-colinearity among the independent variables, making unbiased estimates of the independent effects of these programs problematic. This analysis focuses on the effect of the restorative milieu at CSF Buxmont schools on participating youth, taking into account the mix of auxiliary program exposure, but without attempting to isolate those effects. Therefore, results from this study need to be interpreted within the context of an evaluation of CSF Buxmont schools combined with CSF auxiliary program services.
Performance Measures
The performance of CSF Buxmont schools was evaluated using three distinct measures: program completion, youth attitudes, and offending following discharge.
Program Completion. Restorative practices demand that youth take an active role in maintaining the behavior and safety of the community, so it is expected that CSF Buxmont would retain youth at rates higher than other comparable programs. Therefore, the capacity of any program to retain their clients to normal discharge (i.e. successful program completion as defined above) is an important measure of effectiveness. CSF Buxmont schools admit youth with widely disparate personal and criminal histories. Yet despite this variety of risk factors, CSF Buxmont staff take pride in the fact that they work hard to retain the majority of participating youth to normal discharge/successful program completion.[5] Policy only requires behavioral discharge for behavior that clearly endangers the safety of others in the program.
Youth Attitudes. A successful program will demonstrate measurable positive changes in youth attitudes as a result of program exposure. Changes in youth attitudes were measured by comparing each youth’s response to a series of interview questions designed to measure social values and self-esteem administered shortly after entering the program to those concurrent with their discharge.
Offending Following Discharge. Finally, changes in each youth’s behavior were measured by reviewing juvenile and adult court records and noting any petitions for arrests occurring during the six months following discharge from CSF Buxmont schools. Arrests occurring while attending and resulting in discharge are not included in this measurement. The great majority of youth that offend after discharge do so within six months. While court petitions may not be the best measure of behavioral change, or even recidivism, it is a generally accepted and consistent measure of program success.
RESULTS
Program Completion
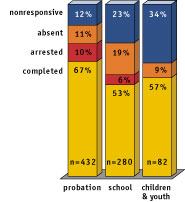
| Figure 1 Reason for discharge by referral source for full school years only. |
 |
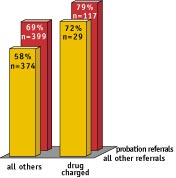
| Figure 2 Percent of normal discharges by referral source and offense groups. |
 |
The capacity of any program to retain their clients to successful program completion/normal discharge is an important measure of effectiveness. Youth who complete a program are more likely to be compliant and therefore are expected to have more positive outcomes than youth receiving behavioral discharges. This potential for selection bias means a program’s completion rate is an important intervening variable between the length of program exposure and the effects of that exposure. Knowledge of the variables that explain noncompletion is critical in order to test and statistically control for this likely source of outcome bias.
Reasons for discharge from CSF Buxmont Schools for the 919 youth were as follows:
1) Youth who completed the program and returned to public school, graduated high school, or completed their GED (66%).
2) Youth discharged because of a new arrest or violation of probation, which resulted in a new placement order for that youth (7%).
3) Youth discharged because of extended absences or who ran away (12%).
4) Youth who otherwise repeatedly failed to respond to the program (16%).
Among the 919 youth in the sample, those referred by probation were significantly more likely to receive a normal discharge (72% of 516) than were those referred by schools (58% of 315) or by children and youth (60% of 88) (ChiSq = 16.4, df = 2, p < .001). A distribution of discharge type more representative of a typical school year is arrived by restricting analysis to data from full school years only (see Figure 1). Thus, successful completion rates for CSF Buxmont schools were 67% of probation, 53% of school, and 57% of children and youth referrals.
Among the 313 youth receiving behavioral discharges, 32% of probation, 12% of school, and none of the children and youth referrals were discharged because of a new arrest. School referred youth were more likely to be discharged for failure to attend (40%) than were those referred by probation (32%) or children and youth (20%). Children and youth referrals were more likely to be discharged for failure to respond (80% of 35) than probation (36% of 147) or school referred youth (48% of 131) (ChiSq = 36.9, df = 4, p < .001).
A multivariate discriminate analysis was conducted on the probability of completing the program successfully in order to determine characteristics that distinguish youth discharged for misbehavior. Results revealed that probation referrals and those charged with a drug offense were more likely than others to complete the program and receive a normal discharge. Also, black girls were less likely than others to receive a normal discharge (Wilks’ Lambda .98, .96, and .97 respectively, all p < .001, with 67% correctly classified).
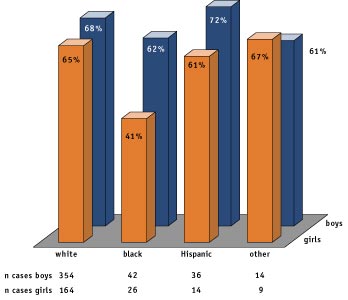
| Figure 3 Percent of normal discharges by race and gender. |
 |
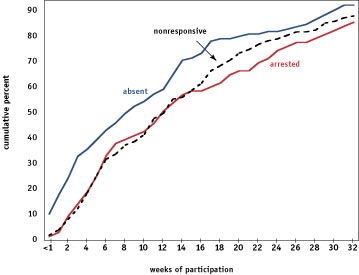
| Figure 4 Cumulative weeks of participation by reason for behavioral discharge. |
 |
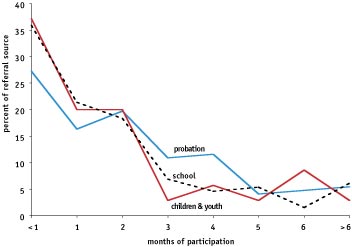
| Figure 5 Distribution of months participation by referral source (behavioral discharges). |
 |
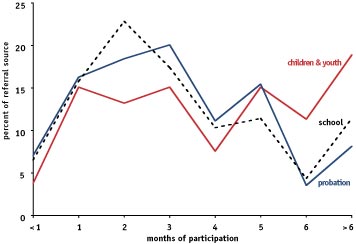
| Figure 6 Distribution of months participation by referral source (normal discharges). |
 |
As seen in Figure 2, a greater proportion of youth charged with a drug offense successfully completed to normal discharge. Also, probation referrals completed at a rate of 7-8% higher than others. Youth charged with a drug offense have an additional 10% higher normal discharge rate among probation referrals and 6% among those referred by other sources.
Figure 3 shows the race by gender interaction effect on discharge type. All race/gender groups except one have normal discharge rates above 60%. The exception was black girls, of whom only 41% were discharged normally.
How a youth is discharged determines, at least in part, the length of their participation. The overall median length of participation was 87 days, but 103 days for normal discharges and 58 days for behavioral discharges (Kolmogorov - Smirnov Z = 4.6, df = 1, p < .001).
A majority of behavioral discharges occurred within the first three months. As shown in Figure 4, youth discharged for failure to attend were more likely to fail during their first week (10% of 63) than nonresponsive youth (2% of 114) or arrested youth (2% of 144) (ChiSq = 11.0 df = 2, p < .01). Half of those discharged for failure to attend had participated for less than 8 weeks, compared to 12 weeks for other behavioral discharges. Differences between the reason for behavioral discharges were not statistically significant beyond the first week.
Within each type of discharge, the differences in the length of CSF Buxmont school exposure between referral types were insignificant (see Figure 5 and Figure 6). Once the higher completion rates of probation referred youth were accounted for, the length of exposure was determined more by the type of discharge than by the referral source. Comparing the two figures reveals that the shape of the distribution of exposure time was different for normal discharges than it was for behavioral discharges (approximating first-order and second-order delay functions, respectively).
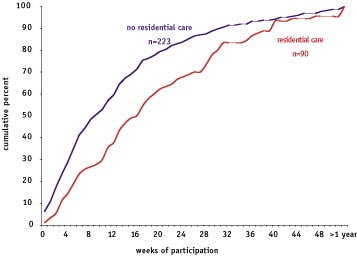
A multivariate survival analysis was conducted on the number of days of exposure for the 311 behavioral discharges. Only one variable was predictive of time until behavioral discharge—youth who were also in CSF residential care remained in CSF Buxmont schools significantly longer than other youth (B = .200, Chi Sq = 10.1, df = 1, p = .0015). As shown in Figure 7, among those receiving a behavioral discharge, youth in residential care remained in the program longer than others. Among those youth not participating in residential care, one-quarter received behavioral discharges by 4 months, half by 9 months, and three-fourths by 17 months. Comparable proportions for residential care participants were 7 months, 16 months, and 29 months respectively. None of the demographic or delinquency variables were significantly related to the time until behavioral discharge. Differences in survival rates were not significant between referral sources, demographic groups, or prior delinquency.
Since residential care is not provided to school referred youth, there is a potential interaction effect between referral source and participation in this auxiliary program. To test whether the increase in survival rates for youth in residential care was simply a proxy for not being a school referred youth, the effect of residential care was tested among probation referrals only. Among this group, youth participating in residential care still had significantly greater survival rates (B = 2.16, ChiSq = 4.9, p = .027).
Youth Attitudes
Among the 723 intake interviews, 88% were conducted within 30 days and 91% within 6 weeks of the start of attendance at a CSF Buxmont school. The remaining intake interviews were excluded from the sample as not accurately reflecting the youth prior to admission, leaving 656 cases with a valid intake interview. Among these cases, 414 (63%) had a matching exit interview. Of these valid matched interviews, the minimum time between measures was 34 days and the maximum was 639 days, or 21 months (one youth with 774 days was excluded from the sample as an outlier). There were 365 (88%) with one year or less between measures and 49 (11%) with more than one year between measures. These interviews measured changes in social values and self-esteem.
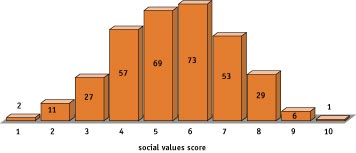
Social Values
ProDES utilizes the 38-item Jessness Values Scale to measure changes in a youth’s attitudes toward social values. The scale ranges from 1 for the least to 10 for the most positive values score. The scale was found to be reliable on both the intake and exit interviews (36 items: Standardized alpha = .838 and .866, respectively). As shown in Figure 8, social values on program entry were normally distributed, with a mean of 5.34 and a median and mode of 5 (skewness = -.08).
| Figure 7 Cumulative weeks of participation by CSF residential care (behavioral discharges). |
 |
| Figure 8 Frequency distribution of social values score on entry. |
 |
| Figure 9 Change in social values by type of discharge. |
 |
| Figure 10 Frequency distribution of self-esteem score on entry. |
 |
| Figure 11 Change in self-esteem by type of discharge. |
 |
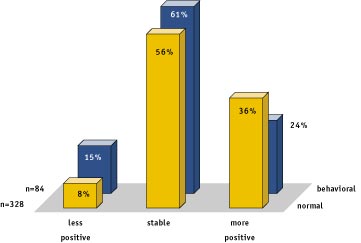
A youth’s value score on entry to a CSF Buxmont school was a good predictor of their score on exit (r = .692, df = 412, p < .001). A few participating youth became less positive (9%), most remained fairly stable in their values (57%), while more than a third developed more positive social values (34%). A majority of all youth showed some improvement between measures. As shown in Figure 9, the net improvement was greater for normal discharges than it was for behavioral discharges. Also, behavioral discharges were nearly twice as likely to become more antisocial than normal discharges (ChiSq = 5.974, df = 2, p = .050).
Youth receiving behavioral discharges had lower social values scores on intake (mean = 4.97), compared to those receiving normal discharges (mean = 5.44) (F = 5.3418, df = 411, p < 0.05). There was an increase of 10.6% in positive social values among youth receiving normal discharges (from 5.44 to 6.01) (paired-t = 7.72, df = 327, p < .001). The 5.7% increase in mean social values for the 84 behavioral discharges, although it was in a positive direction, was not statistically significant (from 5.00 at entry to 5.29 at exit, paired t = 1.97, df = 83, p = 0.053).
Three questions were thought to be particularly useful in testing the effectiveness of restorative practices. These questions were related to acceptance of responsibility. At intake, 90% of all youth in CSF Buxmont schools agreed with the statement, “When I get into trouble, its my own fault”, compared to 100% at exit (paired-t = 6.65, df = 409, p < .001). Also, all youth that participated in CSF Buxmont schools became less likely to agree with the statement, “I am blamed at home for things that are not my fault” (from 56% to 48%; paired-t = 2.87, df = 411, p = .004). Further, normal discharges became less likely to agree with the statement, “I do not get a fair chance” (from 26% to 19%; paired-t = 2.31, df = 328, p = .022), while the change was insignificant for behavioral discharges (from 36.9% to 38.1%).
There were also significant improvements in youth attitudes toward authority as a result of attending CSF Buxmont schools. Youth were more likely to agree with the statement, “Police try to help” (from 47% to 100%; paired-t = 21.22, df = 406 , p < .001). Further, normal discharges were less likely to agree that “People in authority are bossy” (from 59% to 53%; paired t = 2.17, df = 324, p = .031), compared to a nonsignificant increase among behavioral discharges (from 63% to 66%; paired-t = -.60, df = 82, p = .552).
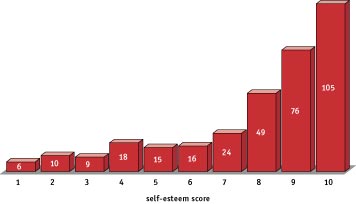
Self-esteem
ProDES utilizes a 10 item self-esteem scale to measure changes in a youth’s self-image. The scale ranges from 1 for the lowest to 10 for the highest. The self-esteem scale was found to be reliable on both the intake and exit interviews (Standardized alpha = .873 and .888, respectively). As shown in Figure 10, self-esteem scores on program entry were highly skewed, with a mean of 7.88, a median of 9 and a mode of 11 (skewness = -1.22). Only 30% percent of youth entering CSF Buxmont schools recorded a self-esteem score below 8 and only 13% a score below 5.
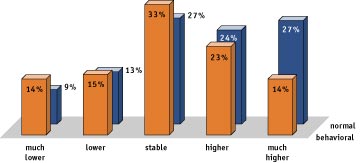
A youth’s self-esteem score on entry was a good predictor of their score on exit (r = .6456, df = 412, p < .001). A few youth had lower self-esteem at exit (10%), most remained relatively stable (66%), and nearly a quarter of youth had substantial increases in their self-esteem (24%). As shown in Figure 11, normal discharges were nearly twice as likely to have a large increase in self-esteem (27%) than behavioral discharges (14%).
| Table 2 Self-esteem Mean Scores at Intake and Exit by Type of Discharge |
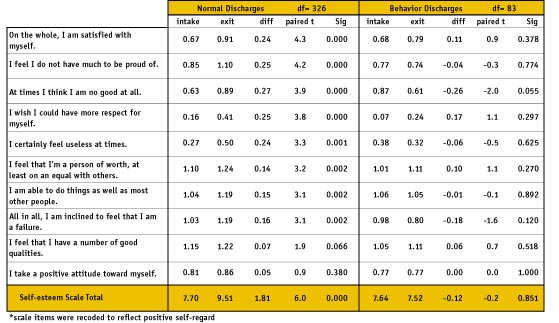 |
Among normal discharges, self-esteem scores improved by 8.8% (from 7.89 to 8.58; paired-t = 6.26, df = 326, p < .001). There was essentially no change in self-esteem scores for youth receiving behavioral discharges (from 7.87 to 7.88, p = .851). Normal discharges also had statistically significant increases on eight of the ten self-esteem questions, while behavioral discharges had no significant change on any of the self-esteem items (see Table 2).
Trends in Attitudes by Program Exposure
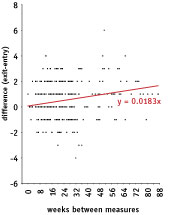
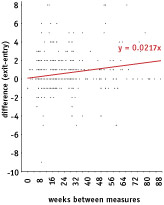
For youth receiving normal discharges, there was a statistically significant relationship between the change in youth attitudes and the length of program exposure (values r = +.157, df = 326, p = .004; esteem r = +.122, df = 326, p = .027). There was no relationship between program exposure and change in social values or self-esteem for youth receiving a behavioral discharge (r = -.012 and -.032, respectively).
| Figure 12 Scattergram of change in social values by weeks between measures (normal discharges). |
 |
| Figure 13 Scattergram of change in self-esteem by weeks between measures (normal discharges). |
 |
As shown in Figure 12, the longer youth who were normally discharged were exposed to CSF Buxmont schools, the more positive their values became. Difference scores for social values increased an average of .0183 for every week of participation. Beginning with the mean social values score on entry of 5.44, this corresponds to 0.34% improvement per week, 1.35% per month, 4.37% after three months, and 8.75% after six months.
There was a corresponding increase in self-esteem scores for youth receiving normal discharges as shown in Figure 13. Self-esteem scores increased an average of .0217 for every week of participation. Beginning from the intake average of 7.89, this change corresponds to 0.28% improvement per week, 1.10% per month, 3.58% after three months, and 7.15% after six months. These improvements in social values and self-esteem were unrelated to referral source, gender, age, race, risk, or to participation in a CSF auxiliary program.
To explore a possible nonlinear relationship between the changes in youth attitudes and the length of exposure to CSF Buxmont schools, mean scale scores for each month between measures were computed for youth discharged normally. Half of these youth had 23 weeks or less between measures (min = 4 weeks, max = 91 weeks). Mean scores for any specific week are very unstable, since most weeks have fewer than 10 cases. A simple smoothing technique was employed to increase the number of cases for any given week by averaging the weighted scores across multiple weeks. The means for all weeks are based upon more than 20 cases when moving averages are computed over a 16-week period.
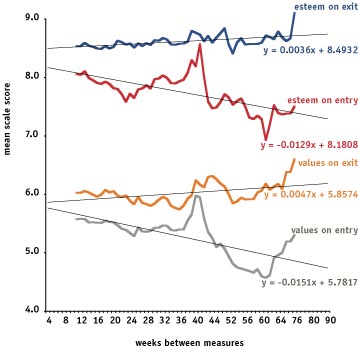
The trends produced by this 16-week smoothing reveal the relationship between the length of participation in CSF Buxmont schools and youth scores at intake and exit. As shown in Figure 14, both social values and self-esteem measures reveal a similar pattern over time. Youth with greater time between measures were more likely to have lower intake values and slightly higher exit scores. Because of the great variation in intake scores and the lack of trends in exit scores, neither are statistically different from zero. Youth with 33-52 weeks between measures had unusually high intake scores which were not reflected in the exit scores, with mean social value and self-esteem scores more than one-half of a point higher than the overall mean (0.510 and 0.671, respectively).
The trends of the difference scores (exit minus entry means) represent an estimate of the effect CSF Buxmont schools have on youth attitudes. As shown in Figure 15, there was nearly a 0.5 point mean improvement in both scales for youth with 9-36 weeks between measures. The effect appears to decline from 20-42 weeks, which is solely the effect of the unusually high intake scores of the youth with 35-52 weeks between measures. The effect on attitudes was most dramatic for youth spending a second year in program (52+ weeks between measures), but no obvious nonlinear trend emerges.
Exit interviews were not conducted with any youth participating for less than 30 days and matched interviews were only available on 22% of normal discharges with 30-60 days in attendance. For these reasons, the data are unable to estimate any tipping point in the shape of the relationship between length of exposure and attitude changes, as it must have occurred within the first 9 weeks following program entry.
| Figure 14 Entry and exit attitudes by weeks between measures, 16 week weighted moving averages, and linear trends (normal discharges). |
 |
| Figure 15 Attitude changes by weeks between measures, 16 week weighted moving averages, and linear trends (normal discharges). |
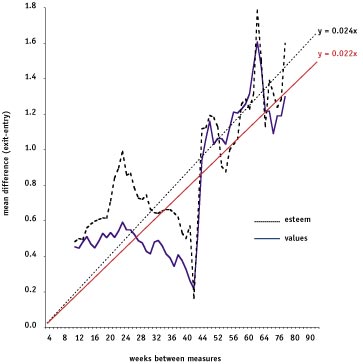 |
Still, the overall trends were toward more positive social values and higher self-esteem the longer youth had participated CSF Buxmont schools. Linear least squares estimates of these trends with zero intercepts have slopes slightly higher than estimated from the zero-order correlations above (.0217 for social values and .0240 for self-esteem). These correspond to a 10.5% increase in social values and a 7.9% increase in self-esteem after 6 months of participation in CSF Buxmont schools.
Offending Following Discharge
Court records were available on 96% of the 919 youth discharged from CSF Buxmont schools. Overall, 10.4% had a new court petition and an additional 5.6% had a petition for a violation of probation filed in juvenile court during the six months following discharge. Behavioral discharges were nearly twice as likely (15.1% of 305) as normal discharges (7.9% of 581) to have a new court petition following discharge (ChiSq = 11.0, df = 1, p = .0009).
School referred youth were slightly more likely to have a new court petition (11.6% of 303) than probation (10.1% of 496) or those referred by children and youth (8% of 87). Also, boys were more likely than girls to have a new court petition (11.3% to 8.0%), but this difference was not statistically significant. Probation referred youth were, of course, more likely to be petitioned for a violation of probation (8%) than school (3%) or children and youth referrals (1%) (ChiSq = 12.8, df = 2, p = .002).
Black youth were nearly twice as likely to receive a new court petition (18% of 91) than other youth (10% of 795) (ChiSq = 5.6, df = 1, p = .017). Youth entering CSF Buxmont schools who were 16 years old or younger were more likely (12% of 621) than older youth (7% of 244) (ChiSq = 4.3, df = 1, p = .038), and those with a prior arrest were more likely (14% of 364) than others (8% of 286) to have a new court petition (ChiSq = 4.1, df = 1, p = .042).
Overall, the proportion of youth with a new court petition during the six months following discharge from CSF Buxmont schools was related to the weeks of participation. The rate of new petitions was 16.2% of the 277 youth who participated less than three months, compared to 7.7% of the 609 participating three months or longer (Lambda = .9878, df = 884, p = .001). For youth receiving a normal discharge, the reduction in offending following discharge held for both new petitions (Lambda = .9915, df = 579, p = .0265) and for all petitions (new petitions and probation violations combined) (Lambda = .9921, df = 579, p = .0317). Length of stay was not significantly related to offending following discharge for youth receiving a behavioral discharge.
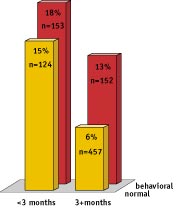
As shown in Figure 16, those that attended for three months or longer and received normal discharges, representing more than half of all youth, had the lowest rate of new court petitions (6.1%). Behavioral discharges with less than three months of participation had the highest rate of offending following discharge (17.6%), followed by normal discharges with less than three months (14.5%), and behavioral discharges participating three months or longer (12.5%) (ChiSq = 20.6, df = 3, p < .001).
| Figure 16 Percent with new court petitions by type of discharge and length of participation. |
 |
| Figure 17 Percent with new court petitions by weeks of participation, 16 week weighted moving average, and linear trend (normal discharges). |
 |
| Figure 18 Percent with new court petitions by weeks of participation, 16 week weighted moving average, and nonlinear trend (normal discharges). |
 |
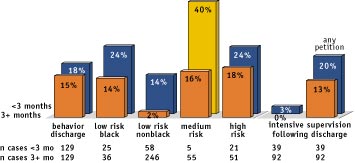
| Figure 19 Percent with new court petitions by length of participation and risk category (plus all court petitions for youth participating in intensive supervision following discharge). |
 |
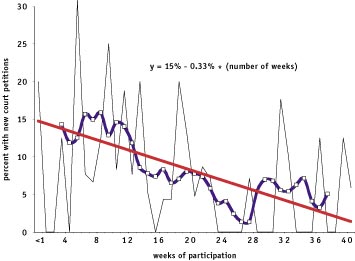
A linear estimate of the relationship between length of exposure to CSF Buxmont schools and new court petition rates for youth receiving normal discharges is shown in Figure 17. Beginning at a 15% rate, the rate of new court petitions was reduced by 1% for every three weeks of exposure, for up to 40 weeks. The rate of new petitions was reduced to 11.4% for youth participating for three months, 7.4% at six months, 3.5% at nine months, and finally to 1.8% at 10 months.
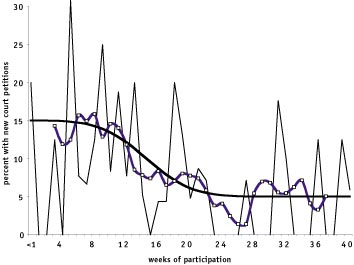
As shown in Figure 18, a nonlinear estimate of the relationship between length of exposure and new court petitions produced a more accurate estimate (r = -.1279, df = 581, p = .002) than a linear estimate (r = -.092, p = .027). The largest reduction was for youth attending for more than 3 months (12-20 weeks). This nonlinear trend reveals a clear tipping point occurring after 3 months of participation with the effect leveling off beyond 5 months.
A multivariate analysis revealed a significant interaction related to offending following discharge between age on admission and existence of a prior arrest history. A risk variable was created to capture this interaction effect to include three categories: 1) low risk includes youth that were over 16 years old upon entry and all youth without prior arrests, 2) medium risk includes youth that were 16 years old with a prior arrest, and 3) high risk includes youth younger than 16 years old with a prior arrest. This risk variable was a strong predictor of new court petitions, with 8% of 641 low risk youth, 13% of 109 medium risk youth, and 19% of 136 high risk youth petitioned for a new offense within six months of discharge (ChiSq = 15.4, df = 2, p = .00045).
Among the risk categories, low risk black youth (19.4% of 62) were nearly three times as likely to be petitioned for a new offense as other low risk youth (6.9% of 579) (ChiSq = 11.6, df = 1, p = .00065). Race was unrelated to the probability of a new court petition among the medium risk (p = .08) and high risk youth (p = .54).
High risk youth were slightly more likely to receive behavioral discharges (41%) than medium risk (35%) or low risk (33%), although these differences were not significant (p = .18). Among normal discharges, risk category was strongly predictive of new petitions following discharge (low = 5%, medium = 15%, high = 18%, ChiSq = 21.1, df = 2, p = .00003), weakly predictive for probation violation petitions (5%, 7%, and 13% respectively, ChiSq = 6.2, df = 2, p = .0444), and strongly for all petitions (20%, 23%, and 30% respectively, ChiSq = 26.5, df = 2, p < .00000). Among youth receiving behavioral discharges, risk category was not predictive of new petitions (p = .19), probation violations (p = .92), or all petitions (p = .35).
A generalized least-squares multivariate analysis revealed that the effect of exposure to CSF Buxmont schools on the reduction of new court petitions (beta = -13.0%, t = 3.2, p = .0014 ) was still statistically significant after controlling for risk (beta = 17.2%, t = 4.3, p < .0000) and race (beta = 9.9%, t = 2.449,p = .0146) (change in R2 = .0460, F = 13.945, p = .000). Additionally, youth who participated in intensive supervision following discharge were less likely to have been petitioned for a new offense than other youth (beta = -8.6%, t = -2.1, p = .0344; change in R2 = .0073, F = 4.494, p = .034).
To isolate the independent effect of intensive supervision, a separate analysis was conducted among the 515 probation referred youth in the sample, 26% of whom participated in intensive supervision following discharge from CSF Buxmont schools. New petitions were filed for 1.5% (2 of 136) of those participating in intensive supervision following discharge, as compared to 13.3% (48 of 360) of youth that did not participate (ChiSq = 15.3, df = 1, p < .001). However, those that participated in intensive supervision following discharge were more likely to be petitioned for a probation violation (14.7% to 5.6% respectively, ChiSq = 11.1, df = 1, p < .001). While the combined new court petition and probation violation rate was somewhat lower among those participating in intensive supervision following discharge (16.2% vs. 18.9%), this difference was not significant (ChiSq = 0.5).
The effect of the CSF Buxmont schools on reducing new court petitions was independent of the other factors related to offending (Wilk’s Lambda RISK = .98, IPAFTER = .95, LRBLACK = .94, and E(RECID) = .96, all p < .001, with 61% correctly classified).[6] As shown in Figure 19, youth who participated for more than three months had lower new petition rates across all risk categories. There were also fewer new court petitions after three months for behavioral discharges and fewer petitions for a probation violation among those participating in intensive supervision following discharge.
CONCLUSIONS
The CSF Buxmont restorative milieu produced positive results in all three performance measures: program completion, youth attitudes, and offending following discharge.
The majority of youth referred to CSF Buxmont schools successfully completed the program with rates of 66% for probation referrals, 53% for school referrals, and 57% for referrals from children and youth. These rates are very high when compared to programs serving similar populations. The average completion rate for programs serving youth placed by Philadelphia Juvenile Court is estimated at 35% for community-based programs and 55% for non community-based programs (excluding boot camps). About 33% of nonadjudicated youth in Philadelphia’s delinquency prevention programs complete their program and 40% simply stopped attending [7] Thus, the completion rates for CSF Buxmont schools are very respectable for a community-based program.
These high completion rates are especially significant because CSF Buxmont schools have a very open referral policy and accept youth with a wide range of offense seriousness and related risk factors.[8] Further, rather than screening out high need youth, CSF Buxmont’s restorative milieu tends to retain them. Youth with the lowest social values and self-esteem scores upon entry were retained longer than others. It was these youth that showed the greatest improvements. This is especially impressive in light of the fact that the proportion of youth receiving a behavioral discharge did not differ by age, gender, race, prior offending, or other risk factors.
Youth were more likely to have more positive social values and higher self-esteem at discharge than at program entry. These improvements were greater for youth completing the program than for youth receiving behavioral discharges and were positively related to the length of participation in CSF Buxmont schools. Youth completing the program had more positive social values and higher self-esteem scores upon discharge regardless of their scores at intake.
Offending during the six months following discharge was reduced by 58% for those youth who completed the program successfully with more than three months participation. Youth in all risk categories were less likely to offend following discharge, including those discharged unsuccessfully, if they participated in the program for more than three months. Finally, the greatest reduction in offending occurred among youth with the highest risk factors for offending.
These results present sufficient empirical evidence to conclude that the changes in attitudes and behavior of youth were the result of participating in CSF’s restorative milieu because:
1) There were significant improvements in both attitude and behavioral measures.
2) These improvements were positively related to the length of participation.
3) The relationships between improvement and participation remained statistically significant after accounting for relevant risk factors.
4) The reduction in offending following discharge after three months participation remained significant after controlling for relevant risk factors and reason for discharge.
Very few programs for delinquent and troubled youth can demonstrate similar positive outcomes. These results provide very strong empirical support that restorative practices are effective and that youth in a restorative milieu will become more positive in their social values, develop an improved self-image, and will be less likely to offend in the future.
Endnotes
1. For more information on CSF Buxmont schools go to: http://www.csfbuxmont.org
2. Wachtel, T. and McCold, P. (2000). Restorative justice in everyday life. In J. Braithwaite and H. Strang (eds.), Restorative Justice in Civil Society. New York: Cambridge University Press; and P. McCold and T. Wachtel (2002). Restorative justice theory validation. In E. Weitekamp and H-J. Kerner (eds.), Restorative Justice: Theoretical Foundations. Devon UK: Willan Publishing.
3. Harris, P., Jones, P., Naiburg, J., and Washnock, J. (2000). Objectives and Outcomes of Community Service Foundation Programs: Results of the Evaluability Assessment Study. Philadelphia, PA: Crime and Justice Research Institute. “The programs of the Community Service Foundation share several common objectives and a mission that includes building among its clients greater self control, a belief in the capacity of people to change, an appreciation of the value of community, and life-styles in which sobriety is the norm. ... The values of believing in people’s capacity to change, the importance of community, the need for open confrontation and the establishment of a few important rules of behavior dominate the agency’s culture.” p.14. Also see Karp, D. and Breslin, B. (2001). Restorative justice in school communities. Youth & Society, 33(2), 249-272.
4. Jones, P., Harris, P. , Grubstein, L. and Fader, J. (2000). Juvenile Justice Trends and Projections. Program Development and Evaluation System. Philadelphia, PA: Crime and Justice Research Institute. Also see: Crime and Justice Research Institute. (1997). ProDES: The Program Development and Evaluation System Reference Packet (rev. 3/19/98). Philadelphia, PA: Author
5. Harris, et al., op. cit.
6. An independent analysis by Peter Jones, Criminal Justice Research Institute, Philadelphia, Pennsylvania, June 27,2002 confirmed a significant reduction in offending for youth receiving normal discharges. Jones identified several variables which, when combined, created a useful risk classification. He found a significant relationship between this a priori risk classification and offending (ChiSq = 31.6, df = 2, p < .001) with an additional effect for program stays of more than 3 months (ChiSq = 9.0, df = 1, p < .003). In a multivariate logistic regression, the odds ratios for time in program show a 65% reduction in the probability of offending when you move from program time of less than 3 months to 3+ months. Separate one-way ANOVA analysis shows that the effect of time in program is significant in one specific type of interaction - high risk youth. These general results were also confirmed by a discriminate analysis. Repeating the analysis on several community-based programs in the PRoDES database failed to reveal a similar effect for any of these programs.
7. Jones, et al., op. cit., and Jones, P., Harris, P., Poulin, M., and Moss, M. (2001). Delinquency Prevention Program Trends and Projections. Prevention Outcome Monitoring Information System (PROMIS). Philadelphia, PA: Crime and Justice Research Institute.
8. Harris, et al., op. cit.